Carbon Dioxide
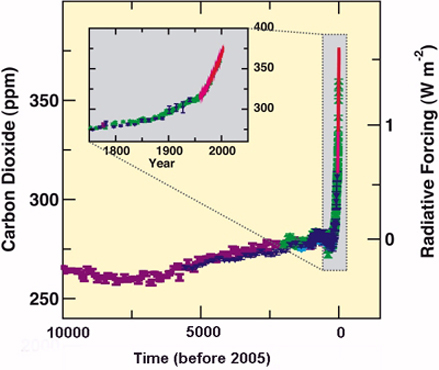
This 2007 IPCC graph depicts atmospheric concentrations of carbon dioxide (CO2) over the last 10,000 years with the smaller inset panel showing levels since 1750. Values are in parts per million (ppm) by volume. Notable for the 21st century is the current rate of change, indicated by the steep slope of data plotted since 1950.
The values plotted on this graph are from ice core samples with different colored symbols representing different sampling missions. The red lines represent atmospheric samples. The corresponding radiative forcing is shown on the right hand axis of the large panel.
Carbon Cycle Processes
This IPCC graphic of carbon cycle processes illustrates the time it takes for CO2 to enter or leave the atmosphere. Human-induced processes related to fossil fuel combustion and biomass burning, shown by the red arrows, involve time periods less than a year and are significantly faster than geologic processes shown by the green arrows.
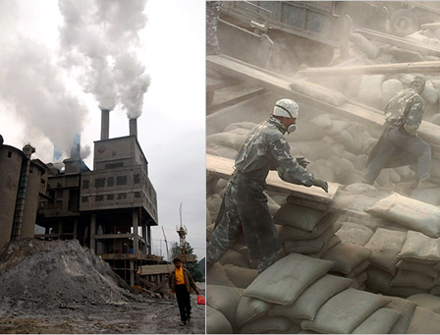
Cement Manufacturing
The 2007 IPCC report specifically referenced cement manufacturing because
the production and distribution of cement accounts for a full 5 percent of global emissions of carbon dioxide annually.
Methane
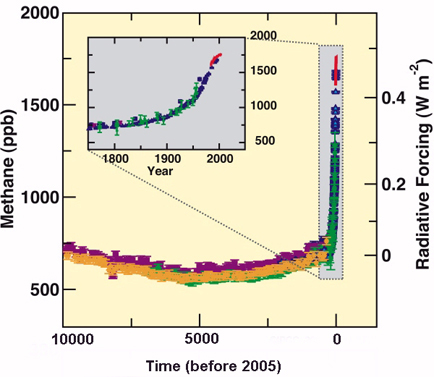
This IPCC graph shows atmospheric concentrations of methane (CH4) over the last 10,000 years with the smaller inset panel depicting levels since 1750. Values are in parts per billion (ppb) by volume. The corresponding radiative forcing is shown on the right hand axis of the large panel.
Methane (CH4 ) is a principal component of natural gas. It is also formed and released to the atmosphere by biological processes occurring in anaerobic environments. While more effective by weight at warming the atmosphere than CO2, methane only makes up about 1770 ppb (0.00017%) of the atmosphere.
Deforestation and Cattle Farming
Earth's climate system is influenced by human decisions, which are complex and involve economic costs and social values.
One example of this involves deforestation by Central and South American cattle farmers, usually by burning old growth forest.
Cleared lands cannot store carbon dioxide like tree-covered forests and the millions of cattle that are raised instead produce copious amount of methane gas.
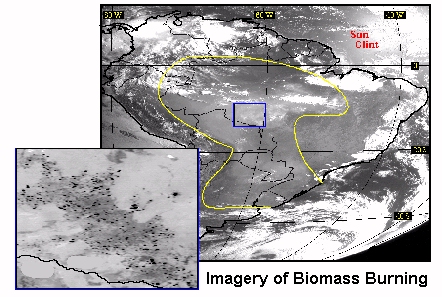
A further stress on the global climate system is the addition of aerosols in the atmosphere when forests are burned, as shown in this 1998 visible satellite image illustrating a large area of smoke outlined in yellow.
The inset infrared image shows where the fires are located in southern Brazil as depicted by dozens of dark dots.
Nitrous Oxide
This IPCC graph shows atmospheric concentrations of nitrous oxide (N2O) over the last 10,000 years with the smaller inset panel depicting levels since 1750. Values are in parts per billion (ppb) by volume.
Note the rate of increase since the start of the industrial revolution as indicated by the steeper slope of the line during the 20th century.

Unprecedented GHG Levels
Proxy data confirms that Earth has been warmer (and colder) in the past. However, current levels of greenhouse gases are unprecedented and rising rapidly.
Even small amounts of heat-trapping gases can significantly magnify Earth's Greenhouse Effect.
It is clear that humans are altering the equilibrium of the climate system.
