Overview
The Atmospheric Emitted Radiance Interferometer (AERI) is a ground-based instrument that measures the downwelling infrared radiance (radiant energy) from the Earth’s atmosphere. The observations have broad spectral content, and sufficient spectral resolution to discriminate among gaseous emitters (e.g. carbon dioxide, water vapor) and suspended matter (e.g. aerosols, water droplets, ice crystals). These uplooking surface observations can be used to obtain vertical profiles of tropospheric temperature and water vapor, as well as measurements of trace gases (e.g. ozone, carbon monoxide, methane) and downwelling infrared spectral signatures of clouds and aerosols.
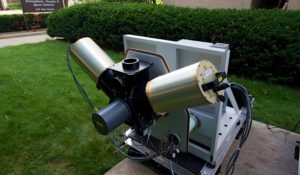
AERI instrument front-end view; undergoing testing at UW SSEC.
Instrument Specifications
The AERI is a passive remote sounding instrument, employing a Fourier transform spectrometer operating in the spectral range 3.3–19.2 µm (520–3020 cm-1) at an unapodized resolution of 0.5 cm-1 (max optical path difference of 1 cm). The extended range AERIs (ER-AERI) deployed in dry climates (e.g. the Arctic) have a spectral range of 3.3–25.0 µm (400–3020 cm-1) that allow measurements in the far-infrared region. Two detectors are used, an HgCdTe and an InSb, cooled to cryogenic temperatures, to cover these spectral ranges. The instrument has a zenith angular field-of-view of 46 mrad full angle. The AERI absolute radiometric accuracy is designed to be better than 1% of the radiance of a blackbody at surface ambient temperature. This level of absolute accuracy is important for climate applications as well as for products derived from AERI radiances. The radiometric accuracy is ensured by regular calibration views of two high-quality blackbodies: the Hot Blackbody (HBB) is temperature controlled to 333 K; the Ambient Blackbody (ABB) passively follows ambient temperature. The AERI averages views of the sky over a 16 second interval; The AERI operates continuously and a sky view is taken approximately every 20 seconds.
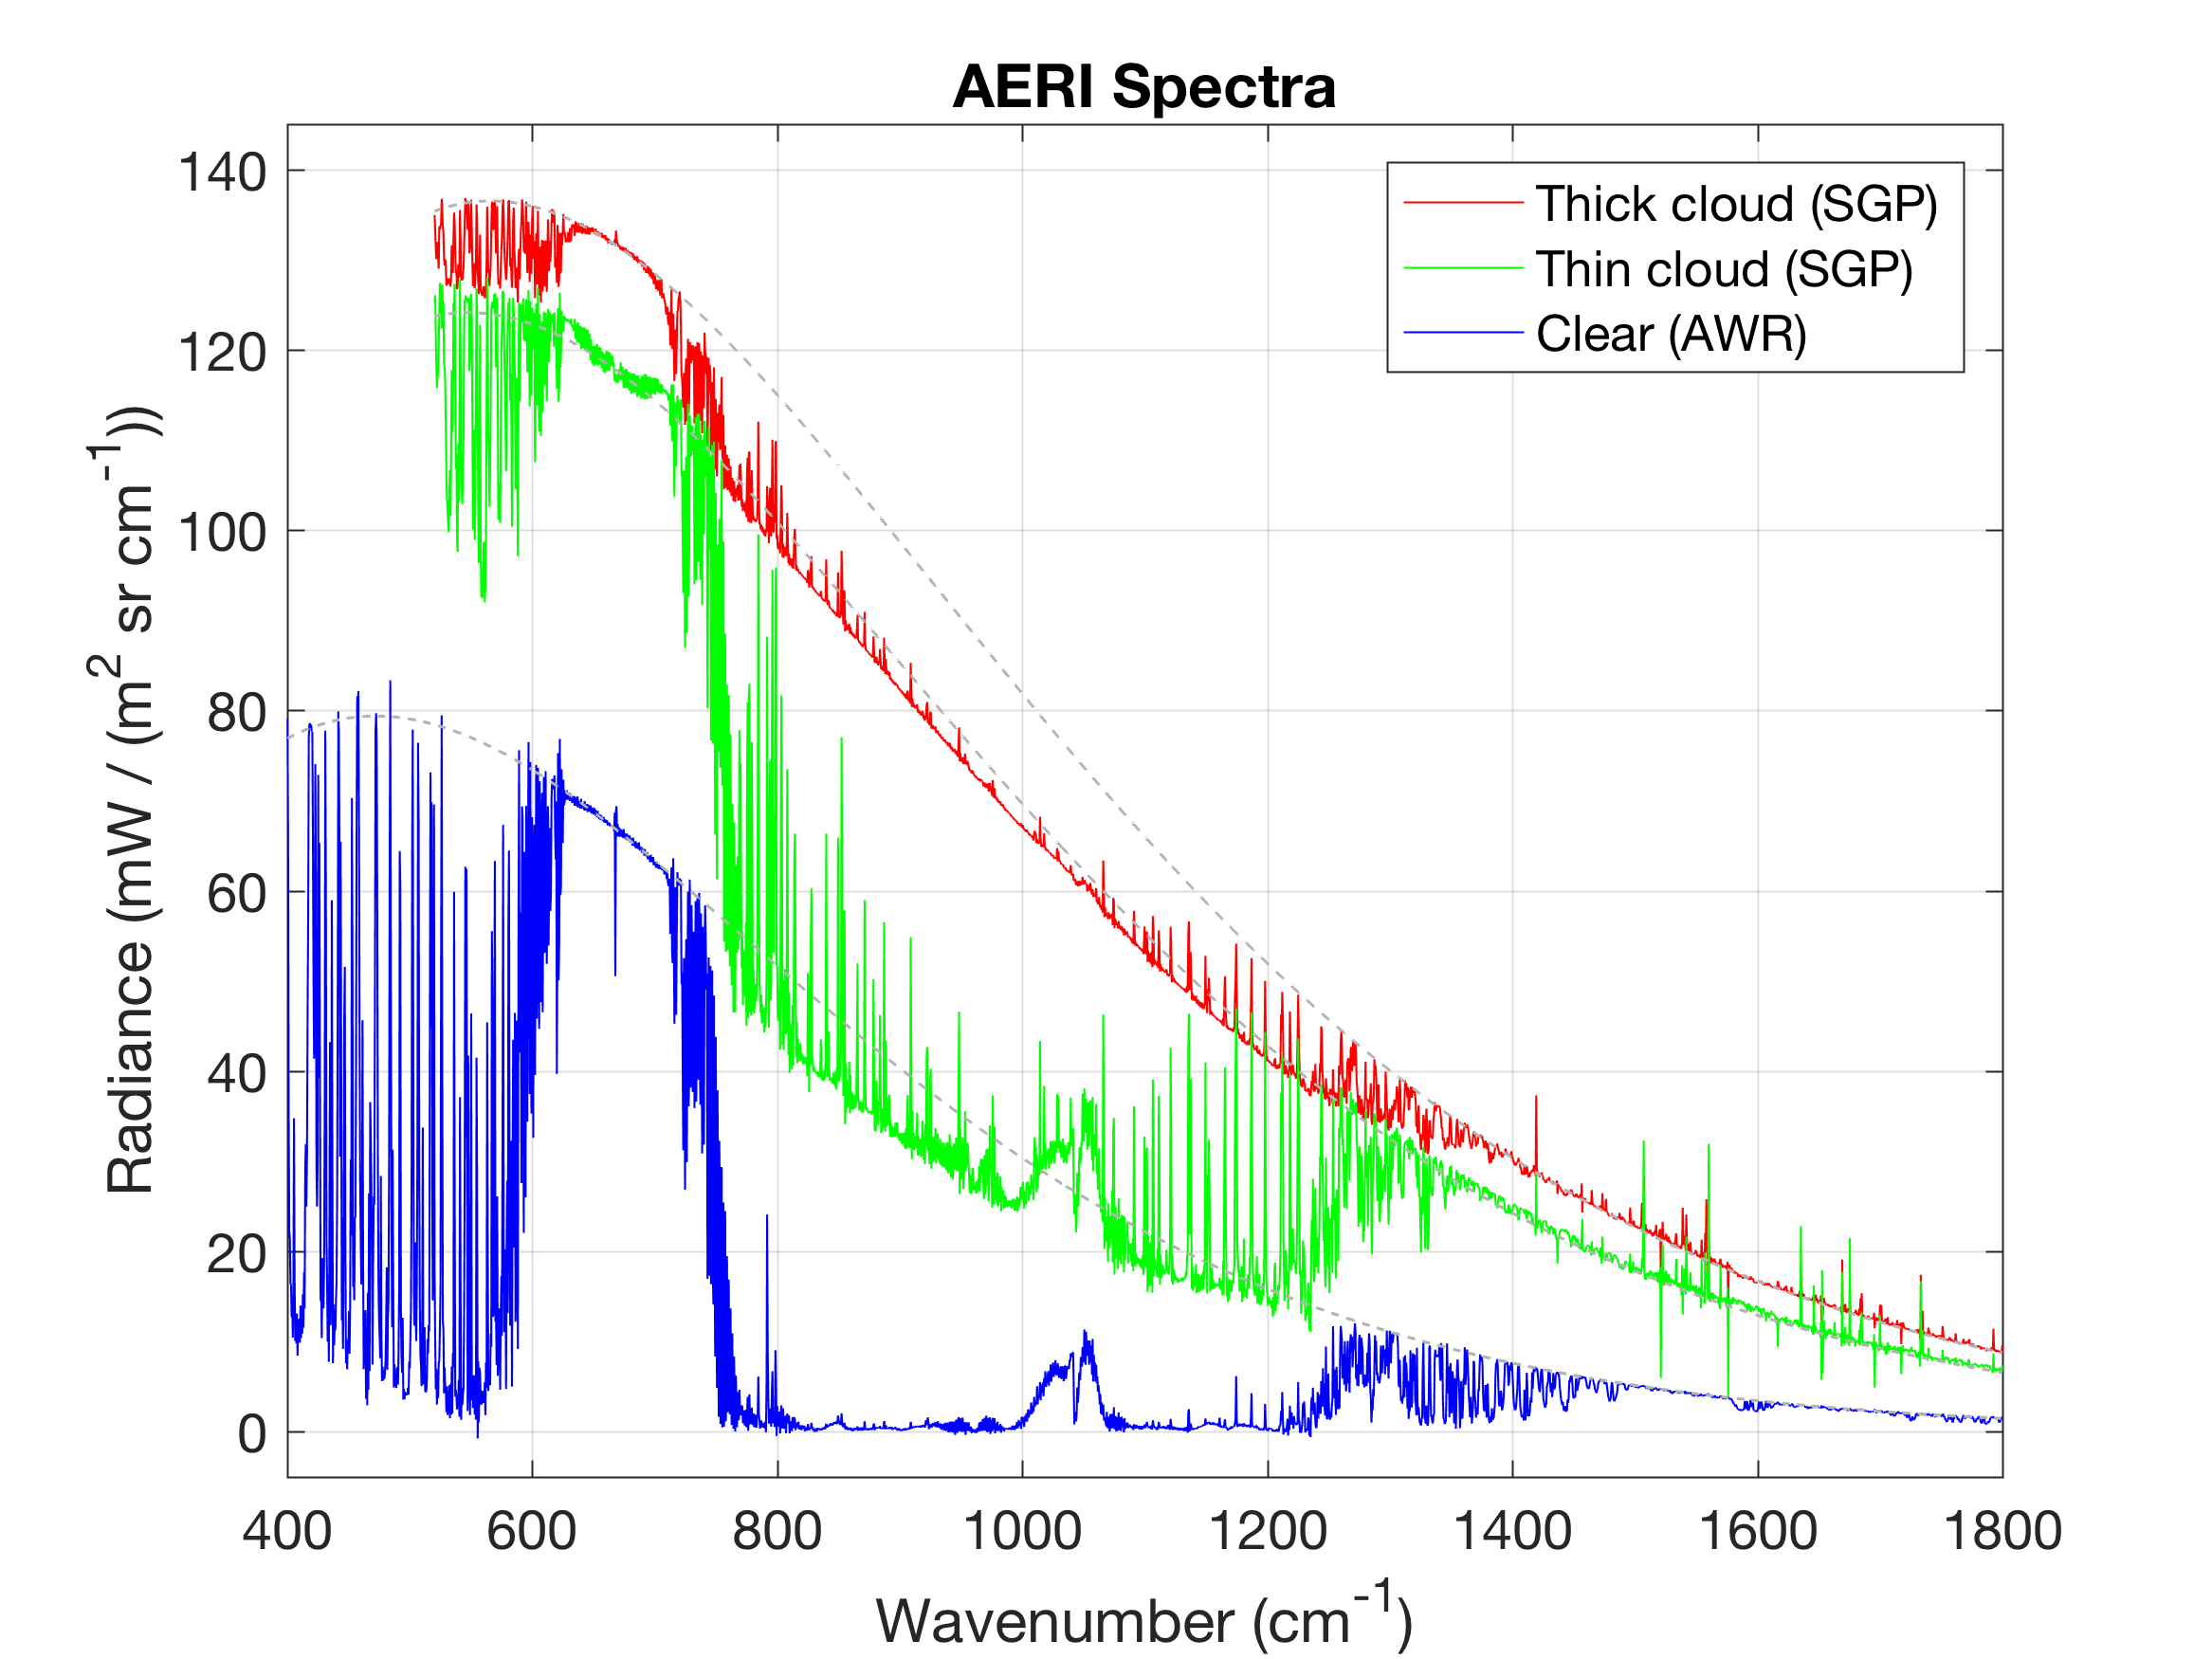
AERI spectra in thick cloud, thin cloud and clear sky conditions.
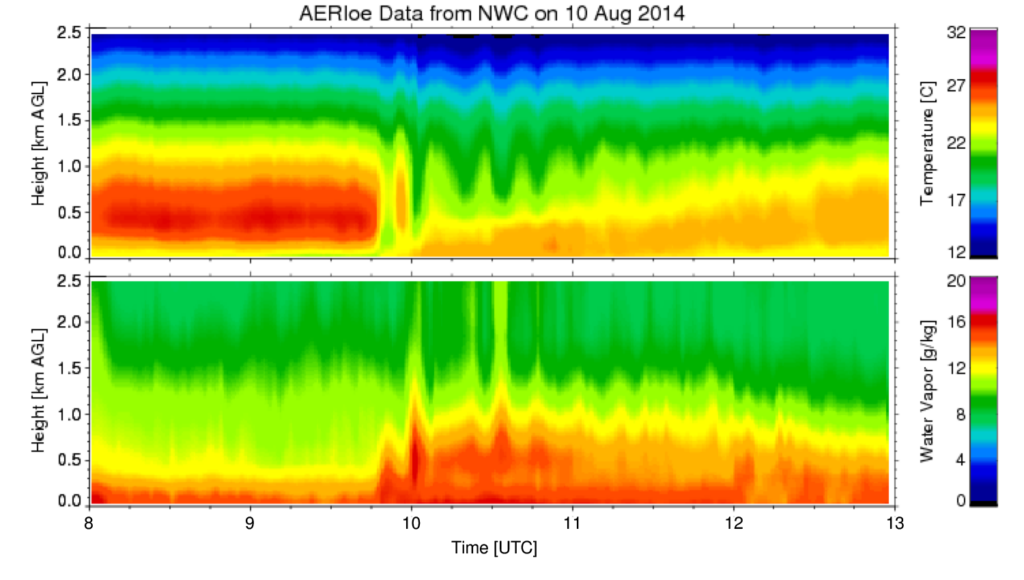
Time-height cross sections of temperature and water vapor concentration over the course of 5 hours showing a nocturnal boundary layer with an elevated bore, at Norman Oklahoma, retrieved from AERI data using the AERIoe algorithm.
History
The AERI was designed by the University of Wisconsin Space Science and Engineering Center (UW SSEC) for the Department of Energy (DOE) Atmospheric Radiation Measurement (ARM) program in the 1990s. The AERI instrument played an essential role in the success of the ARM program by providing an accurate reference in tropical, mid-latitude continental, and arctic atmospheres for the validation of infrared radiative transfer models used in climate models. AERI instruments have since been deployed worldwide. Long-term AERI data records are available at the DOE ARM fixed sites at the Southern Great Plains (SGP, 1995–present), the North Slope of Alaska (NSA, 1998–present), and the Tropical Western Pacific (1998–2014). The AERIs in the ARM Mobile Facilities (AMF) have been deployed for field campaigns throughout the world. The AMF-2 contains a Marine-AERI that is capable of shipboard deployment and can also measure sea surface emissivity and skin temperature.
The AERI technology has been licensed by the University of Wisconsin to the commercial company ABB Inc., who is currently responsible for the manufacture of the hardware and installation of the operating software.
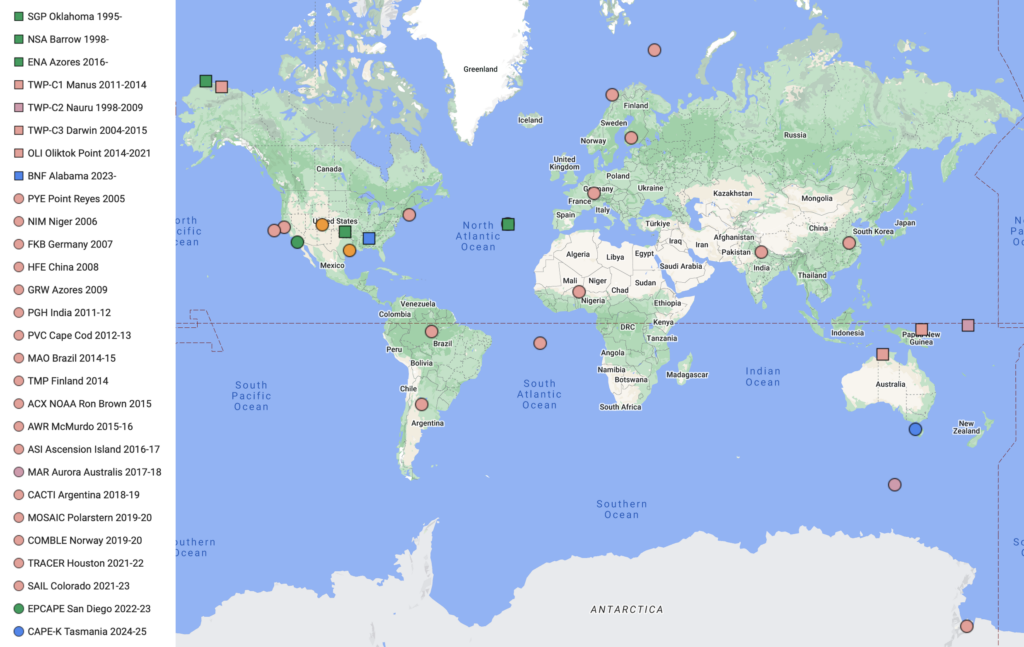
Current (green) and past (red) AERI deployments by DOE ARM at fixed (square) and mobile (circle) sites